
Most L&D teams can prove that training happened – completions, hours logged, attendance records. What they struggle to prove is that it made a difference. Measuring training ROI closes that gap, connecting learning activity to the business outcomes that leadership actually cares about: productivity, compliance pass rates, sales performance, and employee retention.
This guide explains the training ROI formula, the Kirkpatrick and Phillips models that give it structure, the specific metrics your LMS should capture, and a step-by-step method for calculating and presenting impact to leadership. The worked examples are built around Indian enterprise contexts – compliance-heavy industries like BFSI, pharma, and manufacturing where the ROI case is often most straightforward.
Why Measuring Training ROI Matters
Training budgets are scrutinised like any other investment. If L&D cannot connect a programme to a business result, it is the first line cut when budgets tighten. Measuring ROI does three things: it justifies spend, it identifies which programmes work so you can do more of them, and it shifts the conversation with leadership from cost to contribution.
For Indian enterprises running large compliance and onboarding programmes, ROI is also a risk story. The cost of a missed POSH Act compliance deadline, a failed GMP audit, or a slow onboarding ramp far outweighs the cost of the training that prevents it. A manufacturing company that avoids one OSHA-equivalent regulatory penalty through better safety training has already paid for its LMS subscription several times over.
Research from the Association for Talent Development (ATD) consistently finds that organisations with mature measurement practices are significantly more likely to secure budget increases for L&D. The L&D leaders who win bigger budgets are the ones who walk into a review with a defensible number and a clear before-and-after story – not a slide of completion percentages. Measuring ROI, even imperfectly, changes how the rest of the business sees the learning function.
The Training ROI Formula
At its simplest, training ROI is expressed as a percentage:
where Net Benefit = Monetary value of results minus the full cost of the training
A positive figure means the programme returned more than it cost. A figure of 150% means the programme returned Rs. 2.50 for every Rs. 1 spent.
The hard part is not the formula – it is converting learning outcomes into a credible monetary value, and isolating training’s effect from everything else happening in the business at the same time. That is where structured models help.
Count costs fully. The true cost of a programme is not just the LMS subscription. It includes content creation or licensing fees, L&D administration time, and the productive hours learners spend in training rather than on their primary role. Counting only the software licence flatters the ROI figure and immediately undermines your credibility when finance asks how you reached the number.
The Models: Kirkpatrick and Phillips
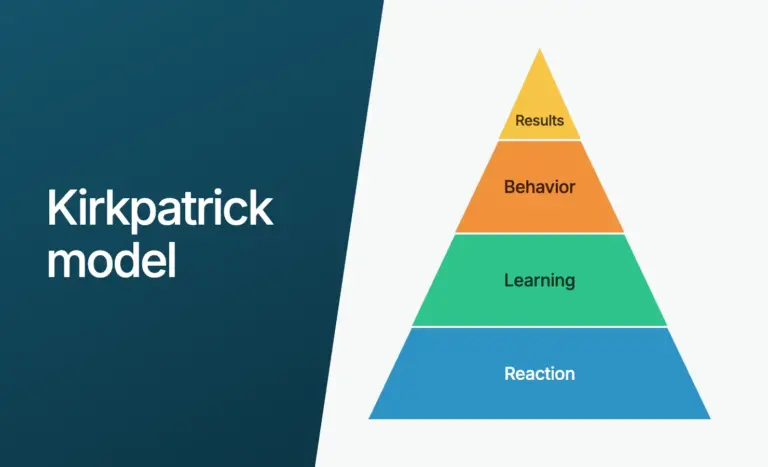
The Kirkpatrick model evaluates training at four levels:
- Level 1 – Reaction: Did learners find the training useful and relevant? Measured through post-course surveys and ratings.
- Level 2 – Learning: Did learners gain knowledge or skills? Measured through assessment scores, quiz pass rates, and pre/post knowledge checks.
- Level 3 – Behaviour: Did learners apply what they learned on the job? Measured through manager observations, time-to-competency, and behavioural assessments.
- Level 4 – Results: Did the training affect business outcomes? Measured through productivity data, compliance pass rates, error reduction, sales figures, and retention rates.
The Phillips ROI Methodology adds a fifth level – converting Level 4 results into a monetary return and expressing them as a percentage ROI. This is the number that resonates with CFOs and business unit heads.
Most organisations measure Levels 1 and 2 easily from their LMS but stop there. The value is in Levels 3 and 4 – behaviour change and business results – which is where training proves its worth. The gap exists because Level 3 and 4 data often lives outside the LMS, in HR systems, CRMs, and operational dashboards. Closing that gap requires integrations and deliberate measurement design, not just better reporting.
The LMS Metrics That Map to Each Level
A modern LMS captures Levels 1, 2 and much of Level 3 automatically through ratings, assessments, completion records, and time-to-competency tracking. Level 4 data comes from your business systems – which is why HRMS integrations and clean data pipelines matter for serious ROI measurement.
| Level | What It Measures | Data Source | Specific Metrics |
|---|---|---|---|
| 1 – Reaction | Learner satisfaction | LMS | Course ratings, post-module survey scores, net promoter scores |
| 2 – Learning | Knowledge or skills gained | LMS | Assessment scores, pass/fail rates, pre vs post scores, quiz retake counts |
| 3 – Behaviour | On-the-job application | LMS + Manager | Time-to-competency, manager observation scores, error/incident rates post-training |
| 4 – Results | Business impact | Business systems | Compliance pass rates, productivity uplift, error reduction, sales per rep, retention rate |
| 5 – ROI | Monetary return | Calculated | Value of Level 4 results minus full training cost, expressed as a percentage |
How to Measure Training ROI: Step by Step
Step 1 – Set the objective and baseline
Define the specific business metric the programme should move – for example, compliance pass rate, onboarding ramp time, or sales conversion rate. Record where it stands before the training begins. Without a baseline, you cannot calculate change, and without change, you cannot calculate ROI. This step is often skipped because it requires planning before the programme launches, not after.
Step 2 – Track learning and behaviour through your LMS
Use your training management system to capture completion rates, assessment scores, time spent per module, and quiz pass rates. For Level 3, set up a manager check-in 30-60 days after completion to assess whether behaviour has changed on the job. AlphaLearn’s manager dashboards and scheduled reports make this straightforward without manual follow-up.
Step 3 – Measure the business result
After the programme, compare the target metric against the baseline. Compliance pass rate up from 72% to 94%? Onboarding ramp time down from five weeks to three? Error rate down 40% in the quarter after safety training? These are the numbers that belong in an ROI report. For compliance training, the result is often also a zero – no penalty, no audit failure, no regulatory action – which still has a calculable monetary value.
Step 4 – Isolate the training effect
This is the most intellectually honest step and the one most L&D teams skip. Use one of three methods: a control group (a comparable team that did not receive the training), a before-and-after comparison with the same group, or a structured manager estimate of what percentage of the improvement was due to the training versus other factors. Conservative attribution – crediting training with 50-60% of an improvement rather than 100% – produces a number that survives finance scrutiny.
Step 5 – Convert to value and calculate
Assign a rupee value to the business result. Saved onboarding weeks have a value (productive output per week per employee). Avoided compliance penalties have a value (the fine, the remediation cost, the reputational damage). Reduced attrition has a value (typically 6-9 months of salary in replacement cost per employee in India). Subtract the full cost of the programme and express as a percentage. See best practices from ATD for industry benchmarks on converting learning outcomes to monetary values.
Present the result as a short narrative: baseline, intervention, outcome, return. Not a wall of numbers – a story leadership can repeat to their peers.
Worked Examples: ROI in Indian Enterprise Contexts
Example 1 – Onboarding ROI for a retailer
A retailer onboards 1,000 new store staff a year. Before structured mobile onboarding, each new hire takes five weeks to reach full productivity. After deploying an employee training platform with mobile-first onboarding paths, time-to-competency falls to three weeks – two weeks saved per hire. If a productive store employee generates Rs. 8,000 of value per week, two saved weeks across 1,000 hires is Rs. 1.6 crore in recovered productivity. Subtract the full annual cost of the LMS, content, and administration, and the ROI is significant even with conservative attribution.
Example 2 – Compliance training ROI for a BFSI firm
A mid-sized NBFC runs mandatory POSH Act and AML training for 2,000 employees each year. Before deploying an LMS, compliance completion rates were tracked manually and hit 78% – leaving regulatory exposure. After deploying structured compliance training with automated enrolment and deadline reminders, completion reaches 99% within 45 days. The avoided cost of a single SEBI or RBI regulatory action – typically running from Rs. 10 lakh to several crore in fines plus remediation – dwarfs the annual LMS cost.
Example 3 – Sales training ROI for a pharma company
A pharmaceutical company trains 500 medical representatives on a new product. The company tracks average prescriptions per rep per month before and after training. If trained reps generate even 5% more prescriptions per month, and each prescription has a known revenue value, the sales uplift is calculable and attributable. Combined with the cost of the training programme, this produces a straightforward ROI figure for the sales leadership team.
Common Mistakes to Avoid
- Relying on vanity metrics: Hours of training completed and enrolment counts show activity, not impact. Leadership already senses this – presenting completion rates as proof of value erodes credibility.
- No baseline: If you did not record where the metric stood before the programme, you cannot prove change. Build baseline measurement into every programme brief, before the course goes live.
- Ignoring Level 3: Knowledge gains (Level 2) do not automatically translate to behaviour change (Level 3). A 90% quiz pass rate does not mean employees are applying the learning on the job. Manager check-ins and observation are required.
- 100% attribution: Claiming that all improvement in a business metric is due to training undermines the entire report. Finance will not believe it, and they are right not to. Use conservative, documented attribution.
- Undercounting costs: Excluding learner time, content costs, or admin hours makes the ROI look better but breaks down the first time someone questions the inputs.
What Your LMS Reporting Should Give You
A well-configured learning management system eliminates most of the manual data collection that makes ROI measurement feel burdensome. For each level of the Kirkpatrick model, your LMS should produce data without additional effort:
- Automated completion and score reports – filterable by department, role, branch, and date range, exportable to Excel for finance review
- Time-to-competency tracking – how long from enrolment to first passing assessment, by cohort
- Course rating aggregation – average learner satisfaction per course, per delivery batch
- Manager dashboards – team-level completion and score visibility without L&D pulling individual reports
- Scheduled reports – sent automatically to department heads and compliance officers on a set cadence
- HRMS integration data – connecting training completion to attrition, performance, and productivity data from your HR system
AlphaLearn’s reporting and analytics features cover all of the above. Explore the full features list or book a demo to see how the dashboards work with your data. You can also start a free trial and connect your own learner data.
Frequently Asked Questions: Measuring Training ROI
How do you measure training ROI?
Set a business objective and baseline before the programme begins. Use your LMS to track learning and behaviour during and after training. Measure the business result after the programme, isolate the share of change due to training using a control group or conservative manager estimate, then convert the result to a monetary value and calculate ROI as (net benefit / full cost) x 100. Present it as a clear before-and-after story, not a table of numbers.
What is the formula for training ROI?
Training ROI = (Net Programme Benefit / Programme Cost) x 100, where net benefit is the monetary value of the business results minus the full cost of the training, including platform fees, content creation or licensing, administration time, and learner productive hours. A positive percentage means the programme returned more than it cost. An ROI of 200% means Rs. 3 returned for every Rs. 1 spent.
What is the Kirkpatrick model?
The Kirkpatrick model evaluates training at four levels: Level 1 Reaction (did learners find it useful?), Level 2 Learning (did they gain knowledge or skills?), Level 3 Behaviour (did they apply it on the job?), and Level 4 Results (did it affect business outcomes?). The Phillips ROI Methodology adds a fifth level that converts Level 4 results into a monetary return expressed as a percentage. Most organisations measure Levels 1 and 2 easily; the real value is at Levels 3 and 4.
Which training metrics should I track in an LMS?
Track course ratings and survey scores for Level 1 (reaction), assessment scores and pass rates for Level 2 (learning), time-to-competency and manager observation scores for Level 3 (behaviour), and business measures such as compliance pass rates, error reduction rates, sales productivity, and employee retention for Level 4 (results). Avoid relying only on completions and hours logged – these show activity, not impact, and will not satisfy finance or leadership in a budget review.
How can an LMS help prove training ROI?
A good LMS automatically captures completion, assessment scores, and time-to-competency without manual data collection. It provides real-time dashboards and exportable reports that connect learner data to business outcomes. Integrated with your HRMS, CRM, or ERP system, it lets you pull Level 3 and Level 4 data alongside learning data and present a defensible, evidence-based ROI to leadership. AlphaLearn’s reporting suite includes scheduled reports, manager dashboards, and compliance exports – all accessible without custom development.
Why is measuring training ROI difficult?
The formula is simple, but two things make it hard in practice. First, converting learning outcomes into a credible monetary value requires agreeing a value for things like a saved onboarding week or an avoided compliance penalty – which involves business stakeholders, not just L&D. Second, isolating training’s contribution from other factors (new management, market conditions, product changes) requires a control group or structured attribution, which most programmes are not designed to measure from the start. Both problems are solvable with deliberate planning before the programme launches.
What is a good training ROI benchmark?
ATD research suggests that well-designed programmes targeting measurable business outcomes typically return between 100% and 400% ROI, depending on the type of training. Compliance training ROI is often the easiest to calculate (avoided penalties versus training cost) and can be very high. Sales training ROI depends on revenue lift per trained representative. Onboarding ROI is measured in recovered productivity from faster ramp times. There is no universal benchmark – the relevant comparison is against your own baseline and against the cost of not training.
Arjun Mehta
HR Technology Consultant
Arjun advises mid-size and enterprise teams on LMS selection, HR tech integration, and digital learning transformation. He has helped 40+ organisations deploy AlphaLearn across India and the Middle East.
Get Started
See AlphaLearn in action
500,000+ employees trained. ISO 27001:2022 certified.