Most L&D reporting stops at one number: the completion rate. It answers “did people finish the course?” but not the questions leaders actually ask — did the training change behaviour, and did it move the business? Learning analytics is how you get from activity to impact. This guide covers what learning analytics is, the metrics that matter, how to read a Kirkpatrick-level dashboard, and how Indian enterprises use analytics to satisfy compliance audits.
What is Learning Analytics?
Learning analytics is the measurement, collection, analysis, and reporting of data about learners and their contexts, for the purpose of understanding and improving learning. The term was formally defined by the Society for Learning Analytics Research (SoLAR) and has become the standard framing for how organisations use LMS data strategically rather than just administratively.
In a corporate setting, the data comes largely from your learning management system: enrolments, completions, quiz scores, time spent, logins, and certification status. Analytics is the layer that turns those raw signals into insight you can act on.
It is worth separating two ideas that are often conflated. Reporting is descriptive — it summarises what happened (“82% of the sales team completed the product knowledge course”). Analytics is diagnostic and predictive — it explains why and points to what to do next (“the 18% who did not complete are all in the North region, where the course was assigned 3 days before quarter-end”). Both start from the same data, but analytics is where the value is.
Why Learning Analytics Matters for Indian Enterprises
For Indian L&D teams, analytics serves three distinct purposes — and the third is often the most urgent:
- Prove impact to leadership: Move the conversation from “people completed training” to “training improved performance”. L&D budgets are routinely cut when the function cannot demonstrate ROI in business terms.
- Improve programmes continuously: Identify the modules with high drop-off or consistently low scores — those are your content problems, not learner problems. Fix them before the next cohort runs.
- Satisfy regulators: For BFSI, pharma, manufacturing, and healthcare organisations, compliance analytics is not a reporting exercise — it is your primary evidence base during RBI, SEBI, CDSCO, NABH, or Factories Act inspections. Real-time compliance dashboards mean you can produce this evidence in minutes, not weeks.
The Learning Analytics Metrics That Matter
You do not need hundreds of metrics. A focused set, tracked consistently, tells you most of what you need to know. These six cover the full picture from activity through to competency:
| Metric | What it tells you | Why it matters | Benchmark to aim for |
|---|---|---|---|
| Completion rate | Who finished a course | Baseline of participation and mandatory coverage | 90%+ for mandatory compliance; 60-75% for optional learning |
| Learner engagement | Logins, time spent, activity frequency | Early signal of interest or disengagement — act before deadlines are missed | At least 2 logins per week during an active programme |
| Assessment scores and pass rates | Whether knowledge was actually acquired | Moves beyond attendance to learning — a completion without a passing score is not evidence of competency | First-attempt pass rate above 75% suggests well-designed content |
| Time-to-competency | How long from enrolment to passing the assessment | Efficiency of onboarding and upskilling — a key ROI signal for HR leadership | Track as a trend over cohorts; falling time-to-competency signals improving content |
| Drop-off points | Where in a course learners quit | Pinpoints exactly which content needs fixing — not a guess, a precise signal | Any module with drop-off above 20% warrants investigation |
| Certification and expiry status | Who is certified, when it expires, who needs renewal | Critical for compliance — a lapsed POSH or GMP certificate is a regulatory finding | Zero lapsed certificates across mandatory training categories |
These metrics connect directly to your assessment software and certification management setup — the quality of your analytics depends on the quality of the assessment data feeding it.
The Four Levels of Learning Evaluation (Kirkpatrick Model)
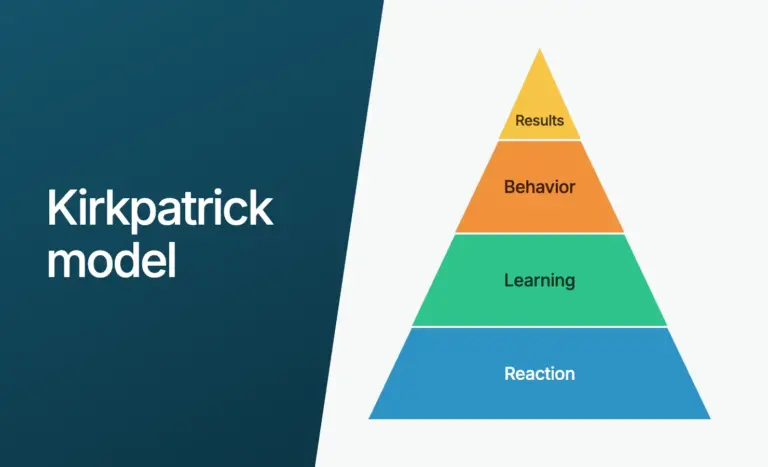
The most widely used framework for evaluating training effectiveness is the Kirkpatrick Model, developed by Dr. Donald Kirkpatrick in 1959 and updated by James and Wendy Kirkpatrick in the New World Kirkpatrick Model (2016). It defines four levels, and most organisations stop at level two — which means they are missing the most valuable data.
| Level | Question answered | How to measure it | LMS data source |
|---|---|---|---|
| Level 1 – Reaction | Did learners find it relevant and useful? | Post-course feedback surveys, star ratings | Course ratings, feedback forms |
| Level 2 – Learning | Did they acquire the knowledge or skill? | Pre/post assessment scores, pass rates | Quiz scores, assessment results |
| Level 3 – Behaviour | Are they applying it on the job? | Manager observation, xAPI data from job tasks, performance reviews | xAPI statements, manager assessments |
| Level 4 – Results | Did the business outcome move? | Error rates, sales conversion, onboarding speed, compliance incidents | HR/CRM data correlated with LMS completions |
A practical India example: a bank deploys an AML awareness programme for 3,000 branch staff. Level 1 — feedback scores average 4.2/5. Level 2 — 89% pass the assessment on first attempt, up from 61% in the paper-based version. Level 3 — branch managers report fewer escalations related to suspicious transaction identification in the 90 days following the programme. Level 4 — the bank’s internal audit in Q3 records zero AML-related findings for the first time in three cycles. That chain of evidence is what moves learning analytics from reporting to ROI.
From Dashboards to Decisions: What Good Analytics Looks Like
Data is only useful if the right person sees it at the right time. Modern learning analytics is delivered through three layers:
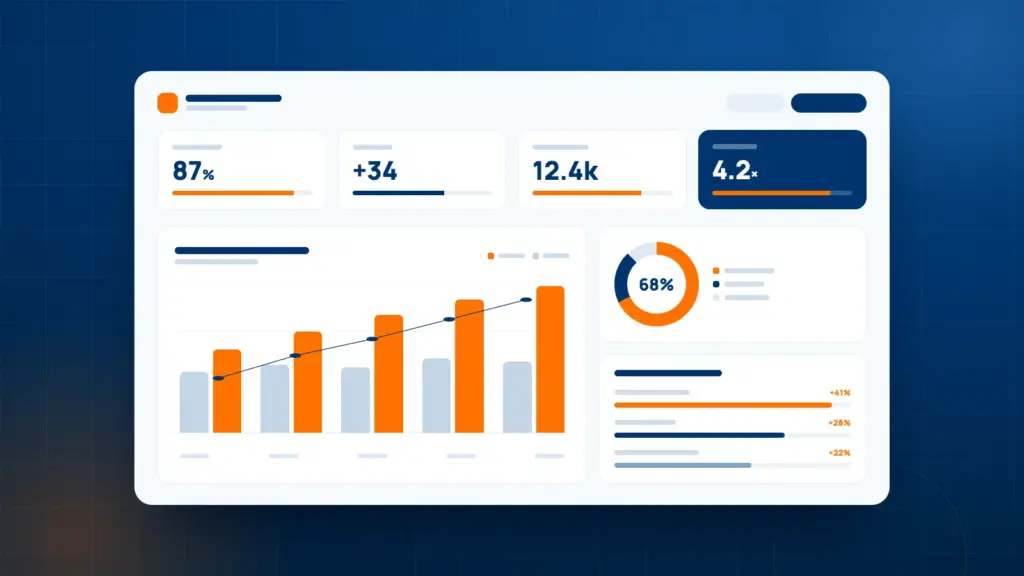
- L&D dashboards: Programme-level view of completion rates, assessment scores, drop-off points, and certification status across the organisation. Updated in real time, not monthly. This is the primary working tool for L&D managers and heads of training.
- Manager-level views: Line managers see their team’s completion and certification status without waiting on HR. A branch manager at a bank can see at 9am that four team members have an RBI compliance module due by Friday — and act on it directly.
- Custom reports: Filterable by department, location, course, role, or date range. Exportable to Excel or CSV for deeper analysis, board packs, or regulatory submission. A one-click export of all POSH completion records for a factory site, for example, or all NISM certification statuses for a brokerage’s research team.
The goal is a short feedback loop: observe a signal (a module with 40% drop-off at the third video), form a hypothesis (the video is too long and too text-heavy), make a change (split it into three microlearning pieces), and measure the result in the next cohort. Analytics that does not lead to action is just a dashboard nobody opens.
Learning Analytics for Compliance in Regulated Indian Industries
For Indian enterprises in regulated sectors, learning analytics is not a nice-to-have — it is the primary mechanism for demonstrating compliance to external auditors. The specific use cases by sector:
| Sector | Analytics use case | Inspecting authority |
|---|---|---|
| BFSI | Real-time view of NISM/AMFI certification status, RBI mandatory training completion, POSH compliance coverage by branch | RBI, SEBI, IRDAI |
| Pharmaceutical | GMP (Schedule M) training completion by batch, version-controlled SOP training matrices, CDSCO audit-ready evidence packages | CDSCO, FDA inspectors |
| Manufacturing | Factories Act safety training coverage by plant and shift, equipment certification expiry dashboard, POSH completion across sites | Factories Act inspectors, BIS |
| Healthcare | NABH training matrix by department and role, infection control certification status, bio-medical waste training coverage | NABH, state health departments |
| All sectors | POSH Act (2013) completion evidence for every employee — exportable by location, department, and date — required for Internal Complaints Committee documentation | Labour courts, ICC |
When an inspection lands, one-click export of your compliance analytics replaces a week of manual evidence-gathering. You can read more about this in the compliance training solution overview.
Going Further: xAPI and Learning Beyond the Course
Traditional LMS analytics captures what happens inside formal courses — enrolments, completions, scores. But a significant share of real workplace learning happens elsewhere: on the shop floor, during a customer call, in a simulation, on a mobile device between shifts.
The Experience API (xAPI), created by the ADL Initiative and maintained as an open standard, solves this. An xAPI statement can record almost any learning-related event: “Priya completed the fire safety drill at the Pune plant at 14:32,” or “Rahul watched the product demo video for 4 minutes 22 seconds on his phone.” These statements feed into a Learning Record Store (LRS) — which may be inside your LMS or separate — and make Level 3 (behaviour) and Level 4 (results) evaluation genuinely practical rather than theoretical.
For Indian enterprises with large frontline workforces, xAPI is particularly valuable because it captures mobile and offline learning events — types of activity that traditional LMS analytics miss entirely.
Common Learning Analytics Mistakes to Avoid
The tooling is rarely the problem — most modern LMS platforms collect far more data than their customers act on. The mistakes that consistently reduce analytics value are process failures, not technology failures:
- Tracking everything and acting on nothing. Pick a focused metric set — the six in the table above — and review it on a fixed schedule (weekly for compliance, monthly for programme improvement). A 40-metric dashboard that no one opens is not analytics; it is data theatre.
- Stopping at completion rate. A 100% completion rate on a POSH module is good news for audit purposes but tells you nothing about whether employees can actually recognise and report harassment. Pair every compliance module completion with an assessment pass rate to have a defensible position.
- Ignoring drop-off data. The point where learners quit a course is your clearest, most specific signal of weak content. A 35% drop-off at module 3 of 5 tells you exactly where to spend your content improvement budget.
- Building reports for L&D only. A compliance dashboard only creates value when the person who can act on it — a branch manager, a plant head, an HR business partner — can see it directly. Gatekeeping data through monthly HR summaries slows the action loop by weeks.
- Treating analytics as an annual exercise. The value of learning analytics is in the continuous observe-change-measure loop. Running it once a year at appraisal season is the equivalent of checking your car’s tyre pressure once annually and calling it maintenance.
- Comparing unlike cohorts. A new-joiner cohort will always have lower completion rates than a team doing annual recertification. Benchmark roles and cohorts against their own historical data, not against each other.
Learning Analytics in AlphaLearn
AlphaLearn provides real-time analytics and reporting built specifically for L&D and compliance teams in Indian enterprises. The platform includes:
- Live dashboards showing completion rates, assessment scores, engagement metrics, and certification status — updated in real time, not on a schedule
- Custom report builder filterable by department, course, location, role, or date range — exportable to Excel or CSV in one click
- Compliance dashboards purpose-built for POSH, RBI, GMP, NABH, and similar mandates — showing who is trained, overdue, or due for recertification at a glance
- Manager-level views so line managers see their team’s training status without waiting on HR
- Assessment analytics that surface question-level failure patterns — so you can see not just that 22% of learners failed the GMP module, but which specific questions they consistently got wrong
- Certification expiry tracking with automated alerts at 90, 60, and 30 days before lapse
- Audit-ready evidence export for regulatory submissions — one click produces completion, score, certificate status, and timestamp records for any combination of courses and learners
All data is hosted on AWS Mumbai region (ap-south-1) and the platform is ISO 27001:2022 certified and DPDP Act 2023 compliant — so the analytics data itself meets Indian data protection requirements. See the full reporting and analytics capabilities on the AlphaLearn features page, or learn more about the platform on the learning management system overview. To see the dashboards with your own data, request a demo or start a free trial.
Key Takeaways
- Learning analytics turns training data into decisions — reporting describes the past; analytics explains it and drives action
- Track six core metrics: completion rate, learner engagement, assessment scores and pass rates, time-to-competency, drop-off points, and certification status
- Map metrics to the four Kirkpatrick levels — most organisations stop at Reaction and Learning; Behaviour and Results are where the business impact evidence lives
- For compliance in regulated Indian industries, real-time analytics is your primary audit trail — not an HR dashboard, but a regulatory evidence base
- xAPI extends measurement beyond formal courses to capture on-the-job, mobile, and simulation learning — making Level 3 and Level 4 evaluation practical
- The value is in the continuous observe-change-measure loop; analytics reviewed once a year is just a report
Frequently Asked Questions: Learning Analytics
What is learning analytics?
Learning analytics is the collection and analysis of data about learners and their training — such as completions, assessment scores, engagement, and time-to-competency — to measure whether training works and to improve it. In practice, a learning management system gathers this data automatically and displays it in dashboards and reports that L&D and compliance teams use to make decisions.
What is the difference between learning analytics and reporting?
Reporting tells you what happened — for example, “82% of the sales team completed the product knowledge course.” Learning analytics asks why and what to do next — which learners are at risk, whether assessment scores predict on-the-job performance, and where content has a drop-off problem. Reporting is descriptive; analytics is diagnostic and, at its best, predictive.
Which learning analytics metrics should I track?
Start with six: completion rate, learner engagement (logins and time spent), assessment scores and first-attempt pass rates, time-to-competency, drop-off points by module, and certification and expiry status. For compliance programmes, certification status is the most critical — a lapsed POSH or GMP certificate is a regulatory finding. Map these to the four Kirkpatrick levels so you move beyond activity metrics toward behaviour and business results.
What is xAPI and how does it relate to learning analytics?
xAPI (the Experience API) is an open standard created by the ADL Initiative for recording learning experiences that happen inside or outside a formal course — simulations, on-the-job tasks, mobile learning, and performance observations. It feeds richer data into learning analytics by capturing activity that a traditional LMS cannot track, making it possible to evaluate Level 3 (behaviour change) and Level 4 (business results), not just course completion.
How does learning analytics help with compliance audits in India?
Compliance analytics shows, in real time, who has completed mandatory training, who is overdue, and whose certifications are about to expire. For POSH Act, RBI guidelines, GMP under Schedule M, or NABH standards, this data can be exported as audit-ready evidence — completion timestamps, assessment scores, certificate issue dates — in a single click. For pharmaceutical companies facing CDSCO inspections or banks undergoing RBI audits, this replaces weeks of manual evidence-gathering with a one-click export.
What are the four Kirkpatrick levels of training evaluation?
The Kirkpatrick Model defines four levels: Level 1 (Reaction) — did learners find the training relevant, measured by feedback surveys and ratings; Level 2 (Learning) — did they acquire the knowledge, measured by pre/post assessment scores; Level 3 (Behaviour) — are they applying it on the job, measured by manager observation and xAPI data; Level 4 (Results) — did the business outcome move, measured by error rates, compliance incidents, sales conversion, or onboarding speed. Most organisations only measure Levels 1 and 2; Levels 3 and 4 are where the ROI case is built.
Arjun Mehta
HR Technology Consultant
Arjun advises mid-size and enterprise teams on LMS selection, HR tech integration, and digital learning transformation. He has helped 40+ organisations deploy AlphaLearn across India and the Middle East.
Get Started
See AlphaLearn in action
500,000+ employees trained. ISO 27001:2022 certified.